solar panel
|
|
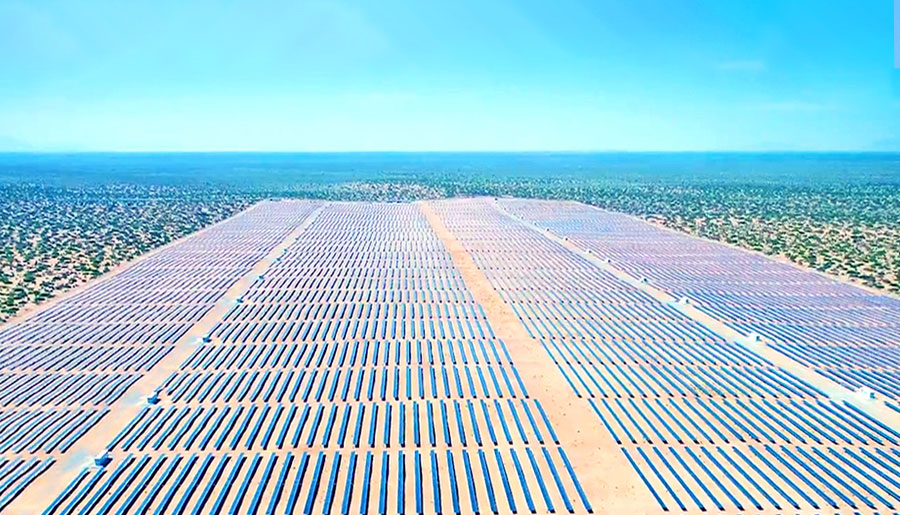
Modern solar modules are built to deliver reliable energy across a wide range of operating conditions, yet one environmental factor consistently shapes their real‑world performance more than most people expect: temperature. While sunlight drives photovoltaic generation, heat can quietly erode efficiency hour by hour. Understanding how the temperature coefficient affects daily power yield helps system owners interpret performance changes, plan installations more effectively, and optimize long‑term returns. Understanding What the Temperature Coefficient Represents Every photovoltaic module carries a specification called the temperature coefficient of power, often written as Pmax (%/°C). It expresses how much the module’s maximum power output changes for each degree Celsius above or below the standard test condition of 25°C. A typical crystalline silicon panel may have a temperature coefficient around –0.30% to –0.45% per °C. That means for every degree the cell temperature rises above 25°C, the power output drops by that percentage. The relationship is predictable, which is why it plays such an important role in energy modeling and field expectations. Thin‑film technologies tend to have a more favorable (less negative) coefficient, one reason they perform relatively better under high‑heat conditions. Why Cells Heat Up Beyond Ambient Temperature A common misunderstanding is that power loss is calculated using ambient temperature. In reality, solar cells operate much hotter than the surrounding air. Several factors elevate the cell temperature: • Absorption of sunlight: A module absorbs radiation; only a portion becomes electricity while the rest turns into heat. • Limited ventilation: Roof‑mounted systems in particular often have restricted airflow behind the modules, trapping thermal energy. • Module construction: Glass, backsheets, and encapsulants have varying levels of thermal conductivity, influencing how quickly heat dissipates. As a result, a mild 30°C day can easily bring cell temperatures into the 50°C range. After sunrise, cell temperature rises quickly as irradiance increases, and with it, the temperature‑related drop in power. How Temperature Coefficient Shapes the Daily Power Curve When charting a plant’s daily energy profile, the temperature coefficient plays a direct role in how high the power curve rises and how long it stays at its peak. Morning Hours: Cooler Cells, Stronger Efficiency In the morning, the air is cooler and the modules haven’t yet absorbed hours of sunlight. Even with moderate irradiance, the conversion efficiency is typically higher because cell temperature remains close to or below 25°C. This is one of the reasons system owners often notice the array feeling more “responsive” early in the day. Many systems experience slightly higher power output relative to the irradiance level during this window. Midday: Strong Sun Meets High Heat As irradiance intensifies late in the morning and approaches midday, the cells warm significantly. This is when the temperature coefficient becomes most noticeable. Even though available sunlight may be optimal, rising cell temperature counteracts part of the gain. The result is that the midday peak power may be lower than theoretical irradiance‑based predictions, especially in regions with strong sun and high ambient temperatures. Several designs attempt to mitigate this midday dip, such as increased module spacing for air circulation or mounting structures that encourage passive cooling. Afternoon: Gradual Power Decline with Thermal Lag After solar noon, irradiance begins to fall but some thermal lag keeps the modules warm. The coefficient continues to reduce power output relative to what cooler conditions would allow. Only later in the afternoon, as modules shed heat, does the influence weaken again. The interplay among declining irradiance, falling temperatures, and changing sun angle shapes the rest of the daily curve. Even though the temperature coefficient does not operate in isolation—shade events, soiling, and inverter limits also shape the curve—its contribution is consistent and measurable. The Impact Across Different Climates Temperature influence varies dramatically depending on the installation environment. A system in a cool coastal region behaves differently from one in an inland desert. Hot or Arid Regions In locations where summer ambient temperatures regularly exceed 35°C, module temperatures can climb to 70°C or more. Under these conditions, a coefficient of –0.40%/°C results in notable midday losses. Over the course of a year, this adds up and contributes to the observed gap between real‑world yields and nameplate expectations based solely on irradiance. Systems installed in hot regions often benefit from module technologies with better thermal characteristics, such as some thin‑film options, or from mounting approaches that encourage airflow. Moderate or Temperate Regions Where temperatures stay in the low to mid‑20s during much of the year, losses from heat are milder. In these climates, the daily power curve stays closer to theoretical predictions, and the coefficient has less overall influence. Nevertheless, the effect still shows up on clear summer days with strong irradiance. Cold Regions Colder regions can even see slight gains relative to nameplate ratings during clear winter days. With sub‑zero ambient temperatures and strong sun reflecting off snow, cell temperatures can remain cool enough that efficiency improves, generating output above the panel’s rated power. This seasonal advantage offsets shorter winter days to a limited extent. Temperature Coefficient and System Design Choices When designing a photovoltaic installation, the coefficient influences multiple engineering and practical decisions. Module Selection Installers and project developers weigh cost, efficiency, degradation rate, and temperature performance. For systems expected to operate under high heat, choosing panels with less negative coefficients can produce higher annual yield. While the difference per degree may seem small, cumulative effects across thousands of hours of sunlight each year become significant. Mounting Approach and Ventilation The same panels can perform differently depending on how well they are ventilated. Rooftop arrays with limited airflow behind the modules typically operate hotter than open‑rack ground systems. Even small design adjustments—such as raised mounting rails or optimized tilt angles—can reduce operating temperature and recover some of the temperature‑related losses. Bifacial Installations and Albedo Effects Bifacial modules introduce additional complexity. Because they absorb light from both sides, they can run slightly hotter depending on ground reflectivity and system geometry. Designers balance improved backside gain with potential thermal implications. Inverter Sizing Temperature‑induced power reductions influence DC‑to‑AC ratio decisions. In hotter climates, some designers allow slightly higher DC oversizing because the array spends less time near its nameplate power under intense heat. Understanding local thermal patterns helps prevent excessive clipping or underutilized capacity. How System Owners Can Interpret Daily Variations Many users examine their daily production graphs and wonder why expected midday output doesn’t always match the highest irradiance levels. Recognizing that the temperature coefficient is constantly influencing the numbers helps make sense of this behavior. Some practical insights include: • Seasonal variation: Summer may have more daylight hours, but elevated temperatures often reduce peak efficiency. Winter may show sharper peaks despite shorter days. • Day‑to‑day changes: Two equally sunny days can yield different results if one is slightly cooler, especially during periods of high irradiance. • Monitoring cell temperature: Some advanced monitoring platforms estimate or record module temperature, giving users clearer insight into system behavior. • Cleaning and shade management: While temperature is unavoidable, reducing soiling and shade helps ensure that the temperature coefficient is the primary driver of performance fluctuations rather than multiple overlapping losses. Emerging Technologies and Improved Thermal Performance Manufacturers continue to refine materials and cell structures to improve thermal behavior. Several areas show promise in reducing the temperature‑related drop in output: • New cell architectures designed to limit resistive heating. • Improved backsheets or glass options with better thermal conduction. • Future materials that inherently respond less strongly to heat. • Enhanced mounting systems aimed at maximizing natural ventilation. While all technologies must obey basic thermodynamic principles, even small improvements in the coefficient can translate to meaningful lifetime energy gains. Bringing the Factors Together Daily power yield is shaped by the dance between sunlight and temperature. Irradiance determines how much energy reaches the panel; the temperature coefficient dictates how efficiently the panel can convert it into electricity. Although users cannot control weather conditions, understanding this relationship offers a clearer view of system performance and explains patterns that might otherwise appear mysterious. For anyone analyzing production data or planning a new installation, the temperature coefficient is a dependable guide to how heat will influence the daily and seasonal energy profile. Over time, informed expectations lead to more accurate forecasts, better system design decisions, and a clearer appreciation of the technology’s real‑world behavior. |
Links: |